ERS’s Charts of Note series, like the above, provides daily snapshots of highlights from current and previous research on food assistance and other topics. Each provides a graph or map with accompanying text.
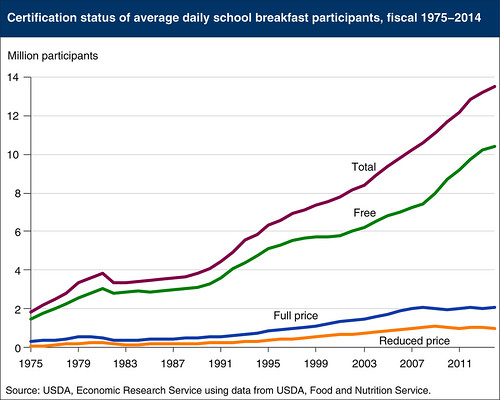
Sometimes called the “most important meal of the day” for school-aged children, breakfast is available at nearly 90,000 schools across the country courtesy of USDA’s School Breakfast Program. On an average school day in fiscal 2014, some 13.5 million students participated. The Economic Research Service (ERS) illustrates the growth of the program in a new entry in its popular daily “Charts of Note” series. As the chart indicates, participation has more than doubled since 1996.
The School Breakfast Program, permanently authorized in 1975, is newer than the arguably-more-renowned National School Lunch Program, established nearly three decades earlier in 1946. The statistics tell an interesting story. Throughout the history of the School Breakfast Program, the number of participating children was considerably smaller than in the National School Lunch Program and is still less than half. Nevertheless, as the breakfast program funding increased—and grants to schools to help start up the program became more available—the number of schools participating in the breakfast program has steadily grown, making it available to more students.
The School Breakfast Program has historically targeted low-income areas where the need is greatest; and its share of reduced-price or free meals has been larger than that of the National School Lunch Program. But as the latest edition of ERS’s Food Assistance Landscape points out, the difference between the two programs in this regard has narrowed, with each serving over two-thirds of its meals at reduced price or free. The “Chart of Note” seen above breaks down the share of full-price, reduced-price, and free meals for the breakfast program. A notable increase in the free and reduced-price share in both programs in recent years likely reflects more children qualifying and choosing to participate during the 2007-09 recession, along with policy changes that have simplified the process of program qualification.
ERS’s Charts of Note series provides daily snapshots of highlights from current and previous research on food assistance and other topics. Each provides a graph or map with accompanying text.
No comments:
Post a Comment